TensorBoard is a very useful tool to visualize your metrics while your model is being trained. The concept behind TensorBoard is the usage of so-called Dashboards in combination with log files. These log files are constantly updated (saved) during the model’s training thus enabling to output metrics and useful debugging information in real time.
To launch TensorBoard (I assume you've already installed TensorFlow) open a Terminal/Console and type following line:
tensorboard --logdir="./logs_output"The argument ./logs tells TensorBoard from which directory the TensorFlow Log-data must be loaded. You can change this according to the parameter log_dir you have defined in your Python code.
The next step is to call following URL: http://localhost:6060
As we have currently no logs produced you will get following screen
![]()
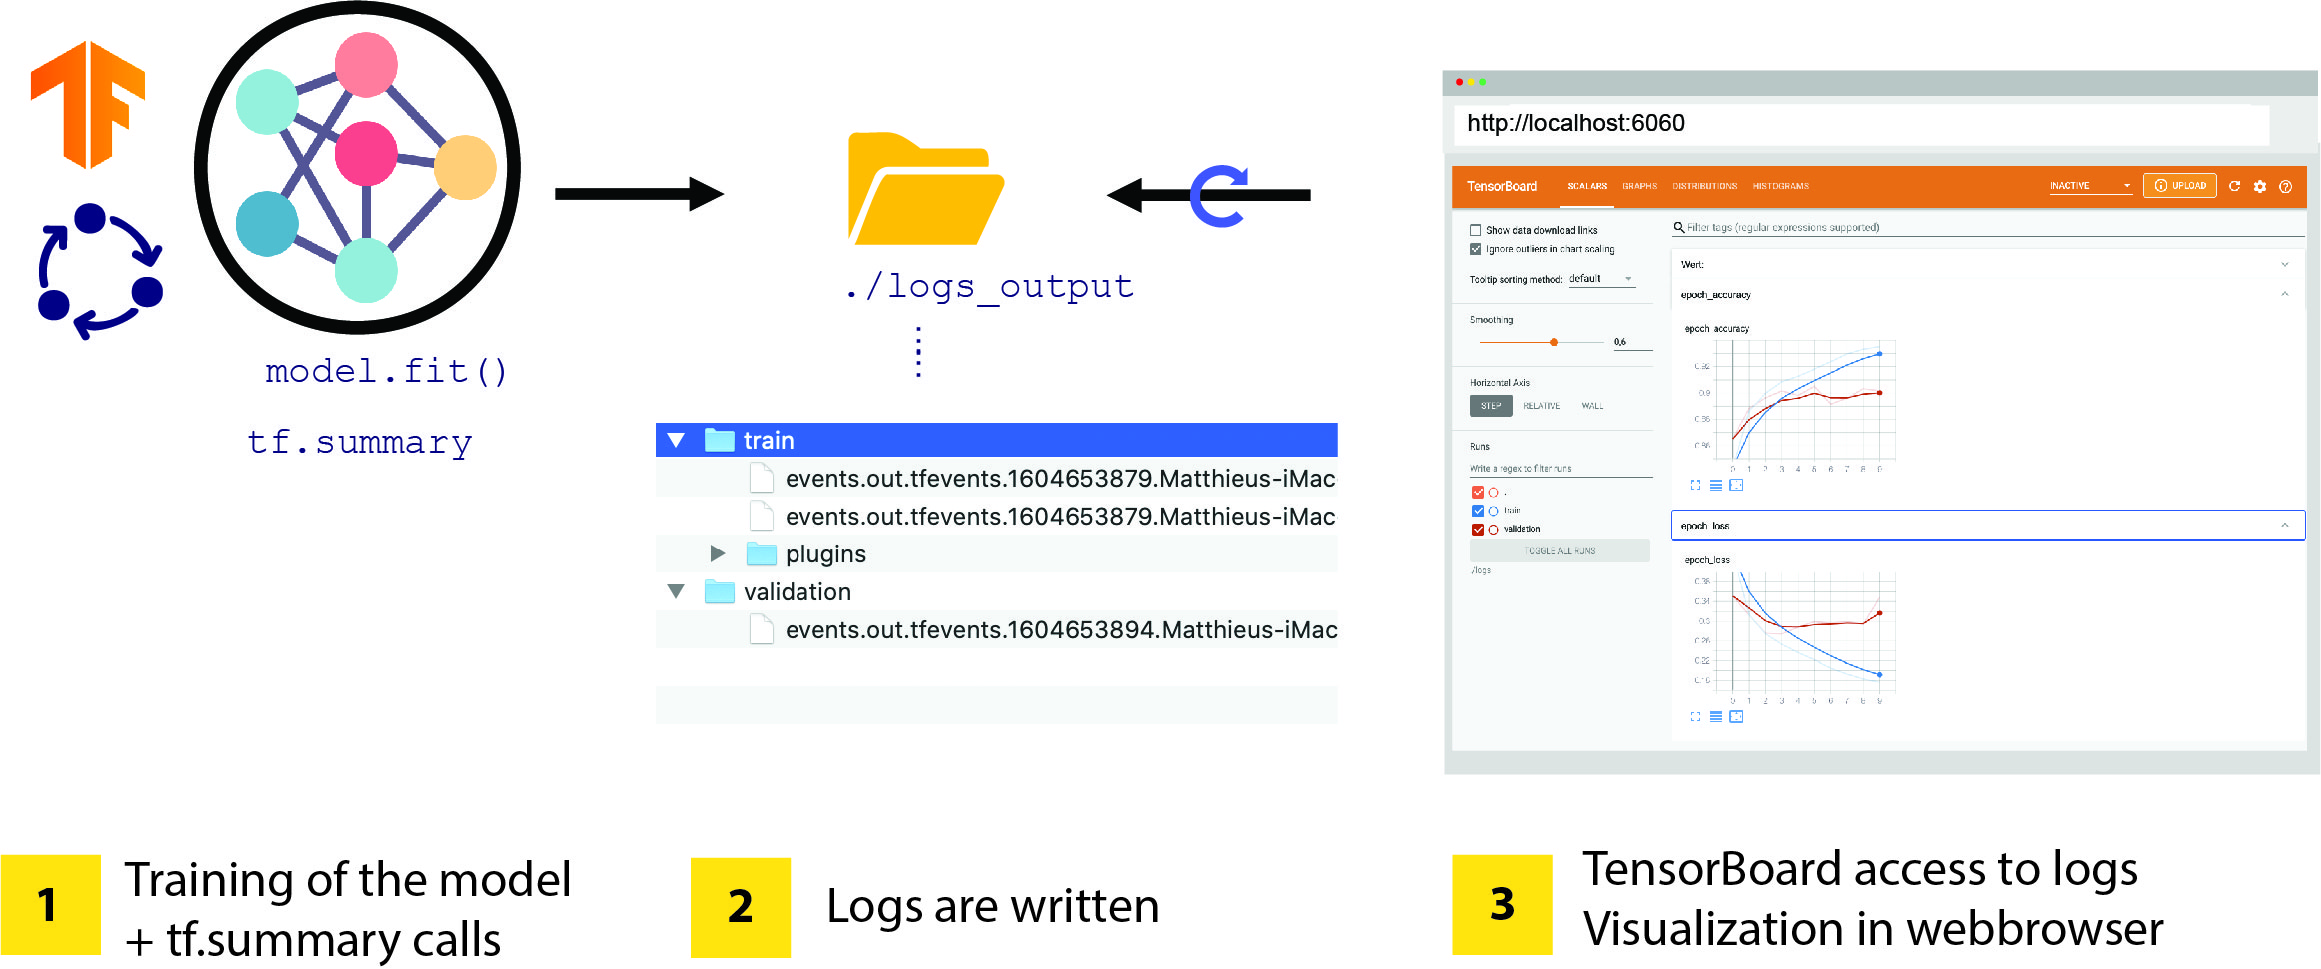
Following picture explains the principle of TensorBoard.
In order to allow to write out to the log-dir we need to define a so-called tf.summary and a directory where the logs are saved.
summary_writer = tf.summary.create_file_writer("./logs_output")There are several tf.summary types in TensorFlow: once writen these log files are read and parsed by TensorBoard. Later will also automatically generate dashboards. When speaking of dashboards within TensorBoard think of visualization areas which can be individually selected for example to check the loss and accuracy via interactive curves, or a graph visualization to better understand the graphs you’ve generated. or even to control the content of tensors. In the last version of TensorFlow you will have about 12 dashboards. Each time a tf.summary is called, an additional corresponding tab will be created in the header.
☝️Note: Before stepping deeper into tf.summary, one thing must be clarified: even if it’s quicker and even easier to use this function to “debug”, don’t misuse tf.summary() as an equivalent of print(). Why? Because each time you are calling tf. summary () the log file must be opened, then the value(s) are written into the file and in a last step the file must be closed. This is obvious that these operations take time and thus having an impact on the performance.
So be careful when using tf.summary especially in loops or if you want to output large data.
☝️Note 2: When starting with TensorBoard you will be sometimes disappointed because nothing is appearing. This is due to two factors: the first one, is that TensorBoard uses an “internal loop” that checks for new logs written in the log_dir directory. Unfortunately the update interval value is set per default at 30 seconds and can only be increased but not decreased. So don’t be too impatient when doing quick checks. If nothing works don't hesitate to read the last section of this article.
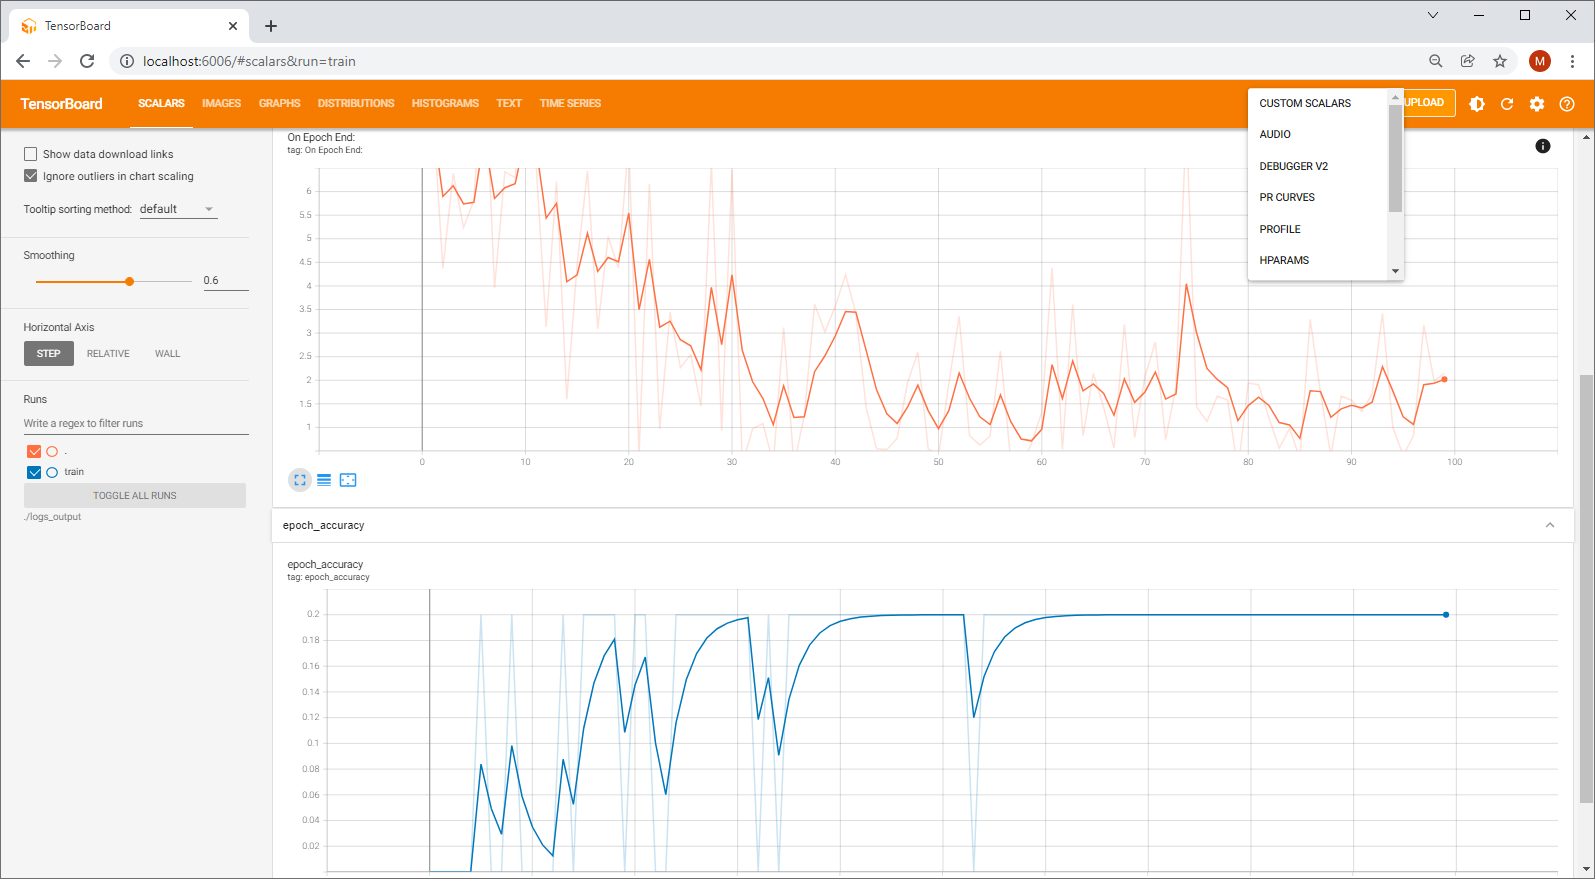
Scalar-Dashboard for metrics
While training a model you certainly want to check how good (or bad) the loss and accuracy metrics are doing. Here there are two very simple ways to do it.
Version 1: With a Keras TensorBoard Callback
The first one is to let Keras/TensorFlow do the job for you and let it deal with the TensorBoard by using a Callback. Callbacks are functions which are called by Keras methods such as fit(), evaluate(), and predict() while your model is being trained. They enable to have a better understanding and to better track the metrics (if needed).
The only thing you will need is to provide is the directory in which the logs are written (here log_dir) and to pass a reference of the callback in the model.fit() function by filling the callbacks array. A good thing with callbacks is that you can call several and combine them.
tensorboard_callback = keras.callbacks.TensorBoard(log_dir="./logs_output")
# Very very simple model :-)
model = keras.models.Sequential()
model.add(layers.Input(shape=(2)))
model.add(layers.Dense(32, activation='relu',name="My_First_Dense"))
model.add(layers.Dropout(0.2))
model.add(layers.Dense(64, activation='tanh',name="My_Second_Dense"))
model.add(layers.Dropout(0.7))
model.add(layers.Dense(1, activation='relu'))
model.compile(optimizer='adam',loss='mse', metrics=['accuracy'])
input = [[0,1],[1,1],[1,2],[2,2],[2,3]]
output = [[1],[2],[3],[4],[5]]
model.fit(input,output, batch_size=64,epochs=100, callbacks=[tensorboard_callback])
Version 2: With a custom Callback
The second version relies on a custom callback. Let’s say you only want to track your metrics at the end of each epoch. Here you only need to fill in the on_epoch_end() function with your own code
class MyTensorBoardCallback(keras.callbacks.Callback):
    def on_train_begin(self, logs=None):
        print("Let's begin the training!")

    def on_epoch_begin(self, epoch, logs=None):
        print("Start epoch #{}".format(epoch))

    def on_epoch_end(self, epoch, logs=None):
        with summary_writer.as_default():
            tf.summary.scalar("Loss at end of epoch:", logs["loss"]  ,step=epoch,description="Loss values at Epoch End")
        print("End epoch #{}".format(epoch))

tensorboard_callback = MyTensorBoardCallback()
and then you can launch the training by passing your customized callback
model.fit(input,output, batch_size=64,epochs=100, callbacks=[tensorboard_callback])Simple isn’t it? The usage of custom callbacks gives you a lot of flexibility. Don't hesitate to have a look in the official documentation to implement your own callbacks https://www.tensorflow.org/guide/keras/custom_callback
Text Dashboard
Now that we’ve discovered how to output Scalars and Metrics let’s step into the Text-Dashboard.
Let’s start with the simplest way to use and create a summary with following lines:
summary_writer = tf.summary.create_file_writer("./logs_output")
with summary_writer.as_default():
 with tf.name_scope('My output'):
    # Als Text + Emoji
    tf.summary.text('Text output"', "Hello TensorFlow 😀",step=0)
    # Als HTML
    tf.summary.text("Table","<table><thead><tr><th>A table</th></tr></thead><tbody><tr><td>Element 1</td></tr><tr><td>Element 2</td></tr></tbody></table>",step=1)
    # Als HTML-Link
    tf.summary.text("Link","Link",step=2)
    # Als HTML-Liste
    tf.summary.text("List","<ol><li>item 1</li><li>item 2</li></ol>",step=3)
In order to have a clean separation of your outputs, you can group them together by using following function:
tf.name_scope()Now the summary output will all appear grouped and you can easily hide/show them by clicking on the accordeon.
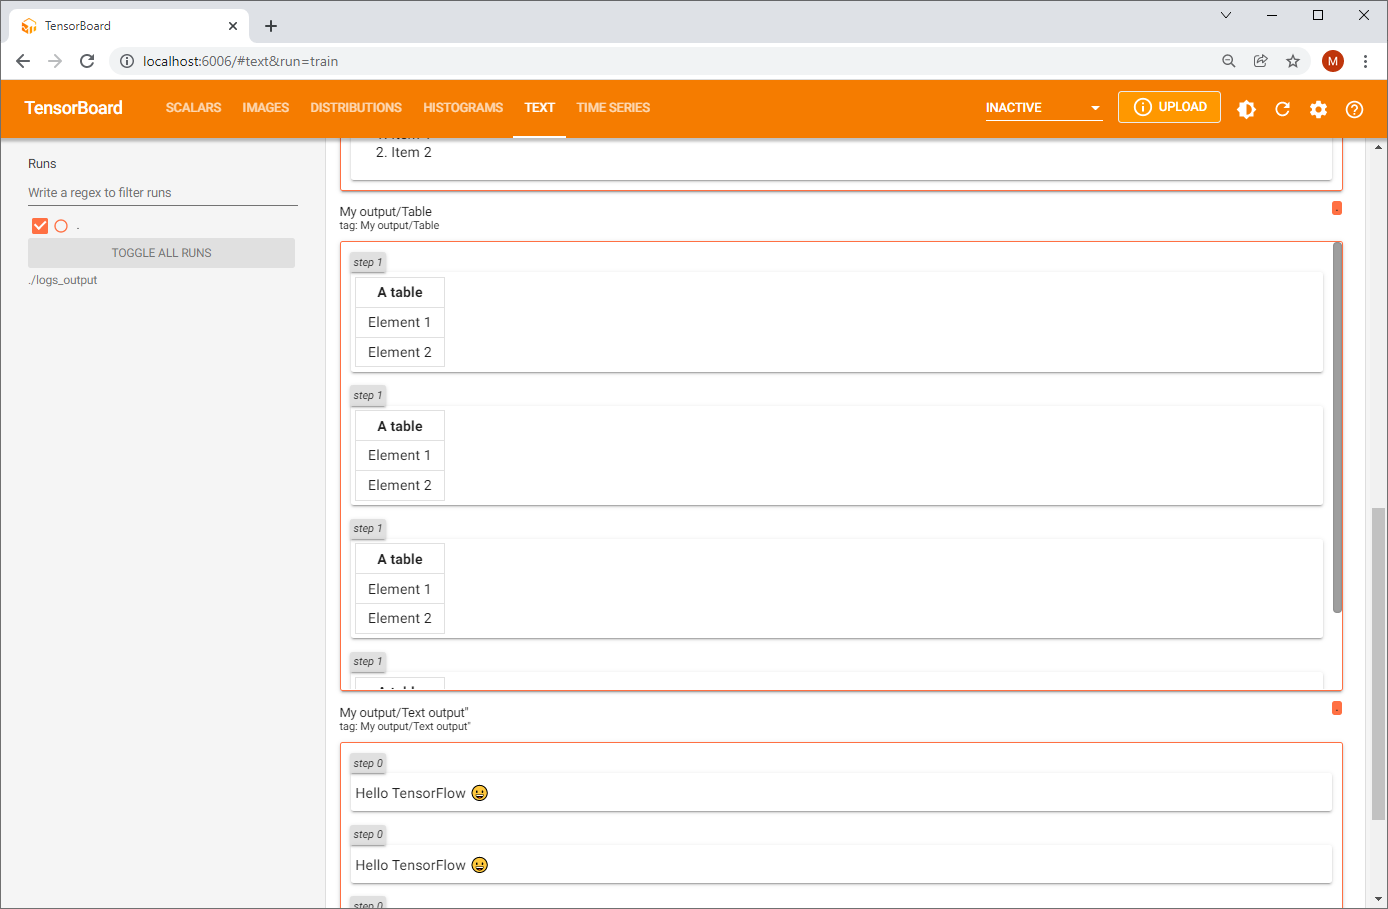
As seen in our small code snipped you can also use HTML tags such as <table>, <li> and even Unicode-Emoji to output your text.
The text dashboard can be very useful if you want to check the content of a text-based dataset (such as IMDB or Reuters) without having to print everything in the console.
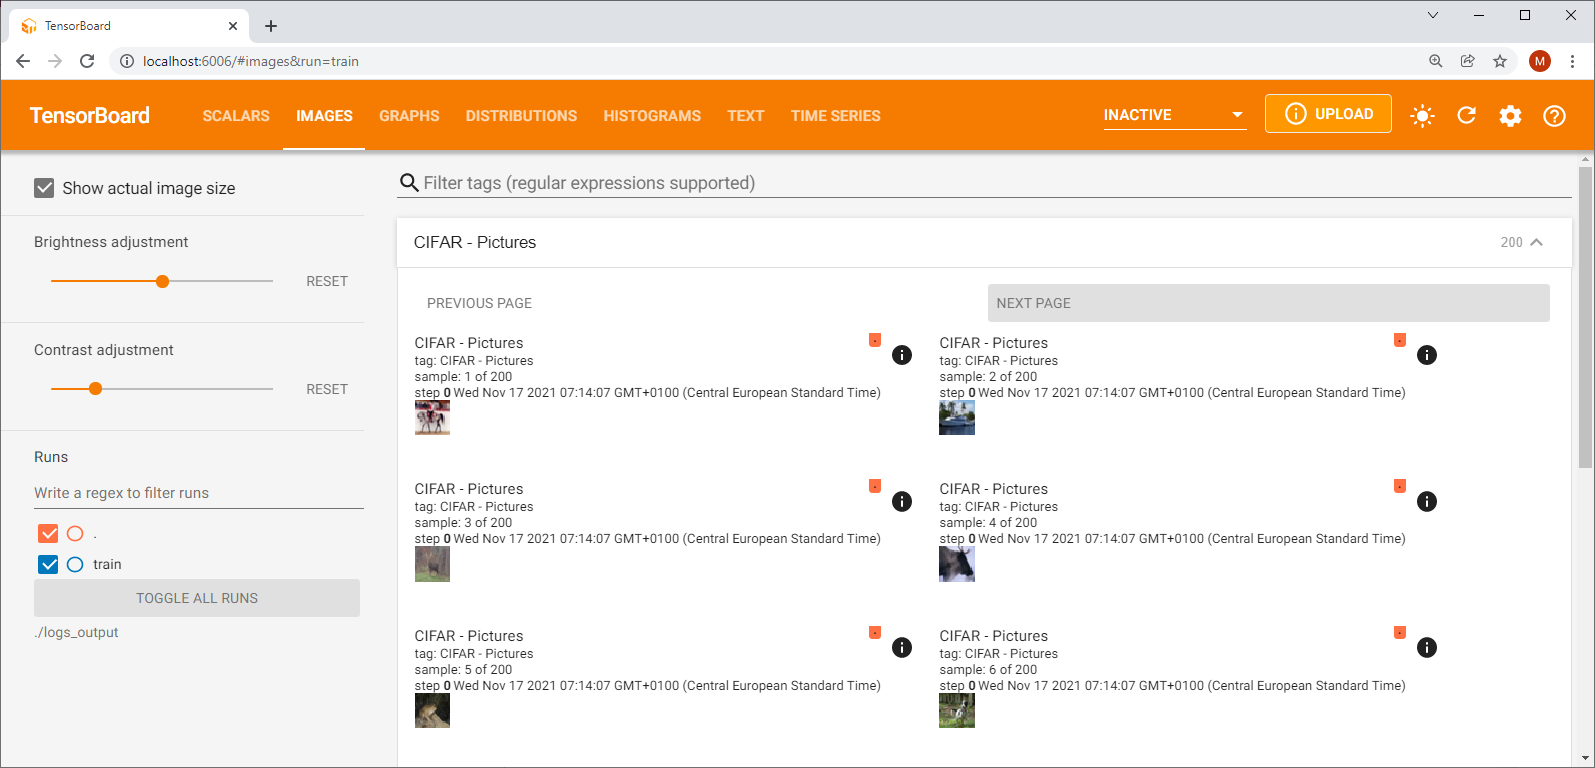
Image Dashboard
Want to quickly check how the image data in your favourite tfds-dataset looks like? Once you have your images loaded you can easily pass those to the tf.summary.image() function and use the Image Dashboard.
import tensorflow as tf
from tensorflow import keras
from keras.datasets import cifar100
from tensorflow.keras import layers

import tensorflow_datasets as tfds
import numpy as np

summary_writer = tf.summary.create_file_writer("./logs_output")

# Loading the CIFAR10 dataset over tfds
ds_train, ds_info = tfds.load('cifar10', split='train', with_info=True)
myImages = []
for img in ds_train:
    myImages.append(img["image"])

    with summary_writer.as_default():
        with tf.name_scope('My output'):
             tf.summary.image("CIFAR - Pictures", myImages,step=0,max_outputs=200,description="Pictures")
Visualizing graphs with TensorBoard
The concept of a graph (a flow graph) in TensorFlow can be very confusing for developers at the beginning. A graph is actually just a set of mathematical functions (also called Ops short for operations in TensorFlow jargon) that are connected thru nodes. During the execution of a graph, the operations are computed and translated into a optimized C++ code. At this TensorFlow also decides which operations can be executed in parallel on the CPU or GPU. GPU - provided that the TensorFlow GPU version and a dedicated graphics card and a dedicated graphics card are installed.
Actually till the release of TensorFlow 2.0, you had to to create your own graph by code and initiate a session that would create and init your graph. Now with TF 2.x with the Eager mode it's easier :-) But where can you see/check this graph?
The trick is to add following line to your code:
tf.summary.trace_on(graph=True, profiler=True)For simplicity I’ve created here a very very simple model (which obviously should learn how to do an addition) and within the model.fit() function. Notice the names given to the layers (“My_First_Dense“, "My_Second_Dense"). It’s a good practice to name them so that you’ll be able to better identify them if you have a more complex model with several layers.
tf.summary.trace_on(graph=True, profiler=True)
tensorboard_callback = keras.callbacks.TensorBoard(log_dir="./logs_output")

class MyTensorBoardCallback(keras.callbacks.Callback):
    def on_train_begin(self, logs=None):
        print("Let's begin the training!")

    def on_epoch_begin(self, epoch, logs=None):
        print("Start epoch #{}".format(epoch))

    def on_epoch_end(self, epoch, logs=None):
        with summary_writer.as_default():
            tf.summary.scalar("Loss at end of epoch:", logs["loss"]  ,step=epoch,description="Loss values at Epoch End")
        print("End epoch #{}".format(epoch))

model = keras.models.Sequential()
model.add(layers.Input(shape=(2)))
model.add(layers.Dense(32, activation='relu',name="My_First_Dense"))
model.add(layers.Dropout(0.2))
model.add(layers.Dense(64, activation='tanh',name="My_Second_Dense"))
model.add(layers.Dropout(0.7))
model.add(layers.Dense(1, activation='relu'))

model.compile(optimizer='adam',loss='mse', metrics=['accuracy'])

input = [[0,1],[1,1],[1,2],[2,2],[2,3]]
output = [[1],[2],[3],[4],[5]]
model.fit(input,output, batch_size=64,epochs=100, callbacks=[MyTensorBoardCallback(),tensorboard_callback])
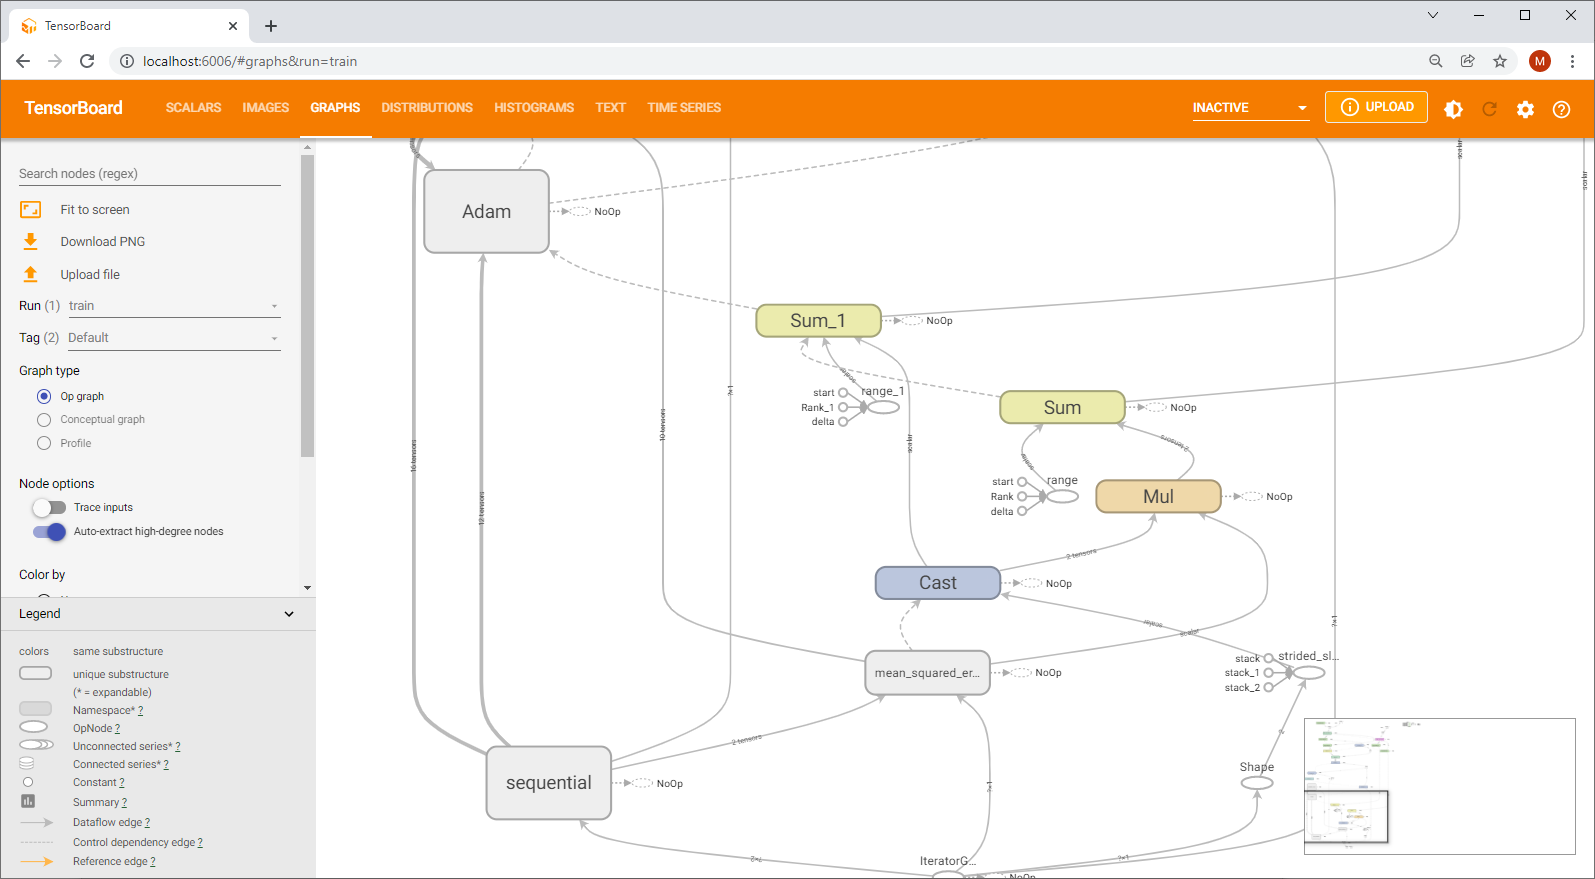
Launch your code and wait for a few seconds: now you will see a “Graphs” tab in the header.
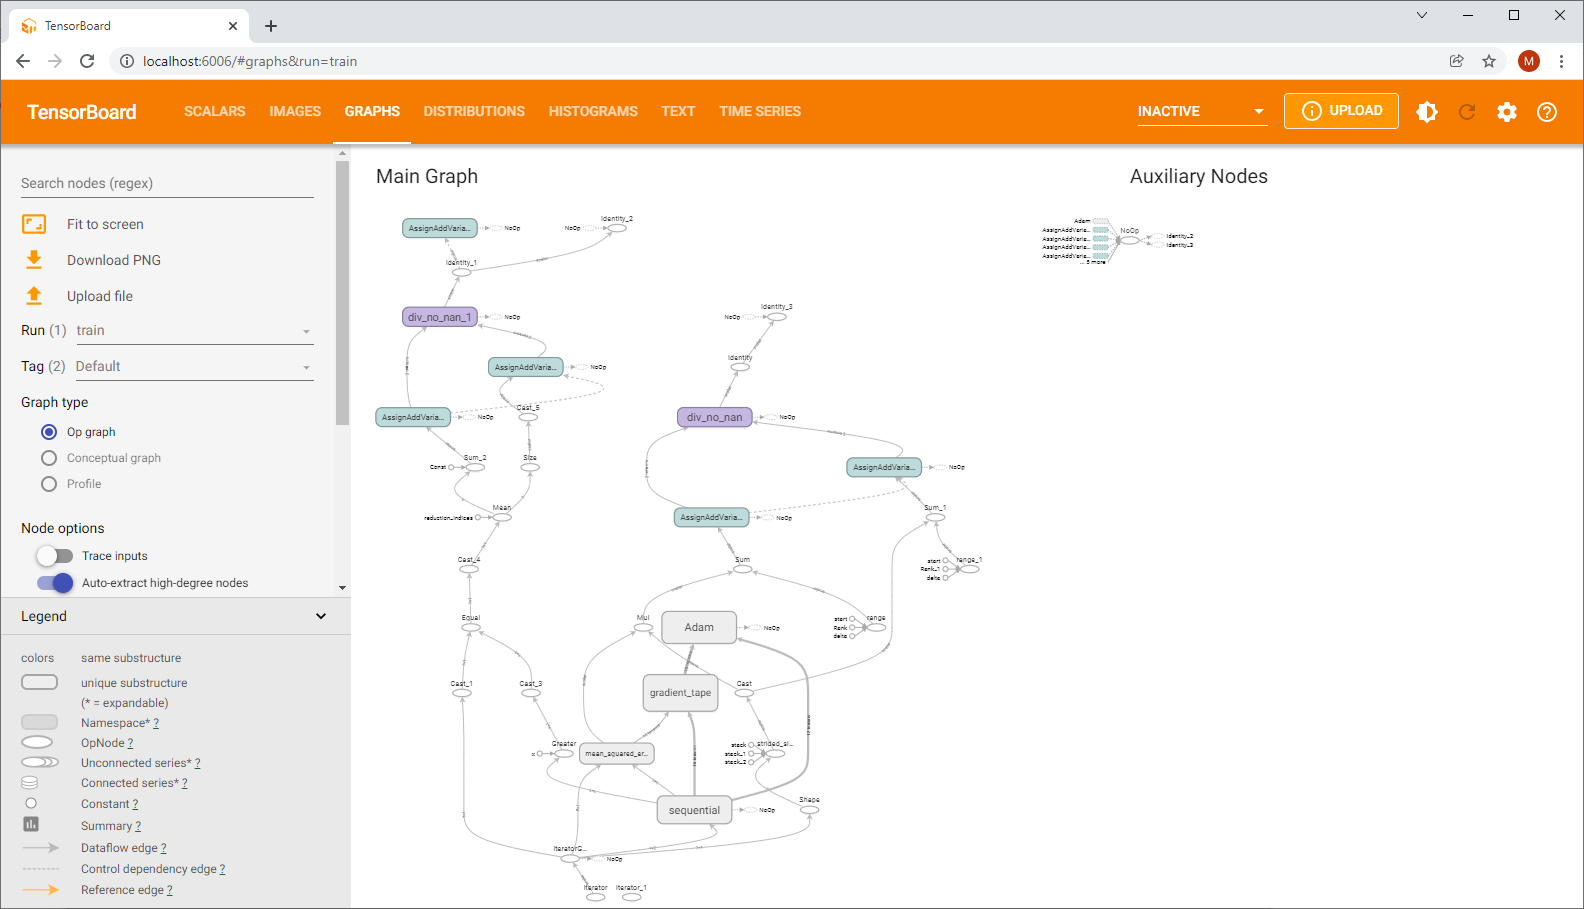
Now select the Tag “default” and you will see the so-called Op-graph which lists and displays (hurray here is our graph :-) ) the internal operations (TensorFlow-Functions) called in the background when you are setting up your model. You will easily recognize operations such as the optimization functions (“Adam” or even the loss-calculation (here MSE)).
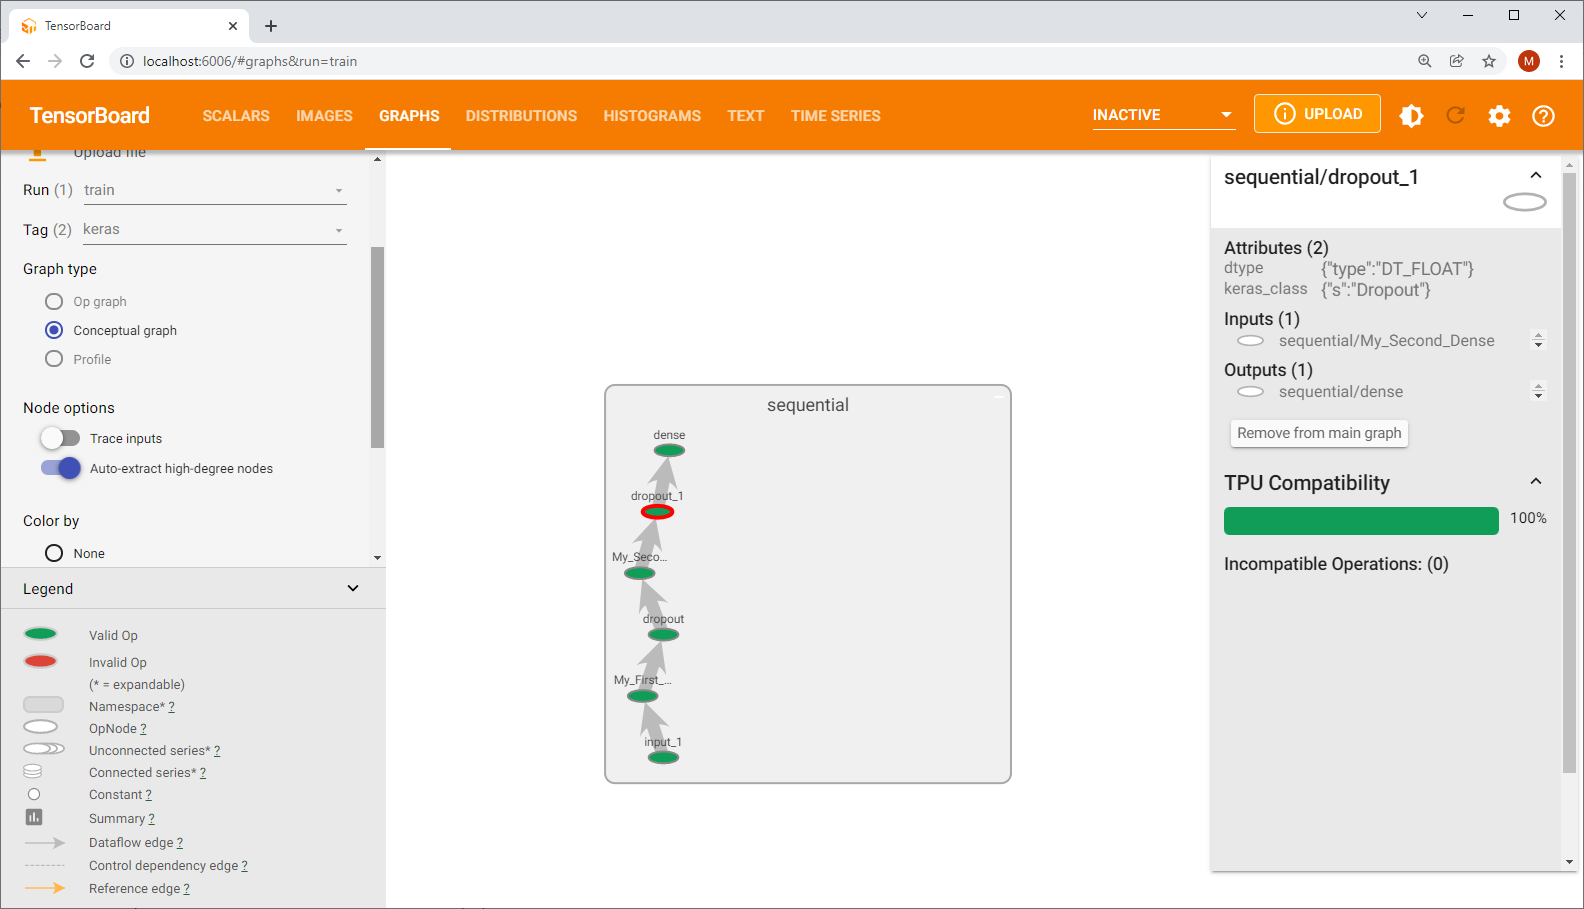
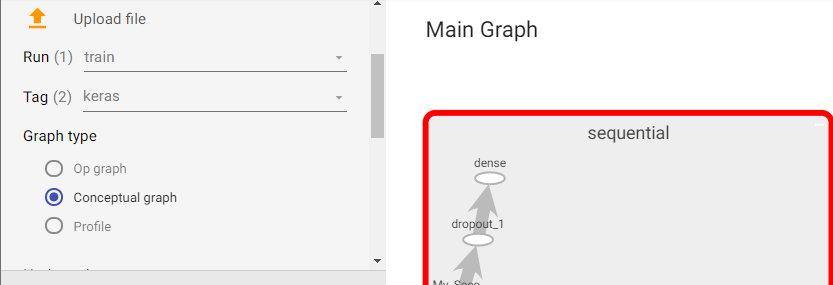
To have a simpler view of your model change the tag to “keras” : now you will get the “conceptional graph” which shows on a higher level the structure of your model. The "Color by" option enables to color part of the graph which are computed on CPU/GPU or TPU.
Debugger V2
If you want to dive deep into debugging and understanding how Ops and Tensors are called and how long a single operation last then you can use Debugger V2.
To enable this you only need to add following line in your code
tf.debugging.experimental.enable_dump_debug_info("./logs_output", tensor_debug_mode="FULL_HEALTH", circular_buffer_size=-1)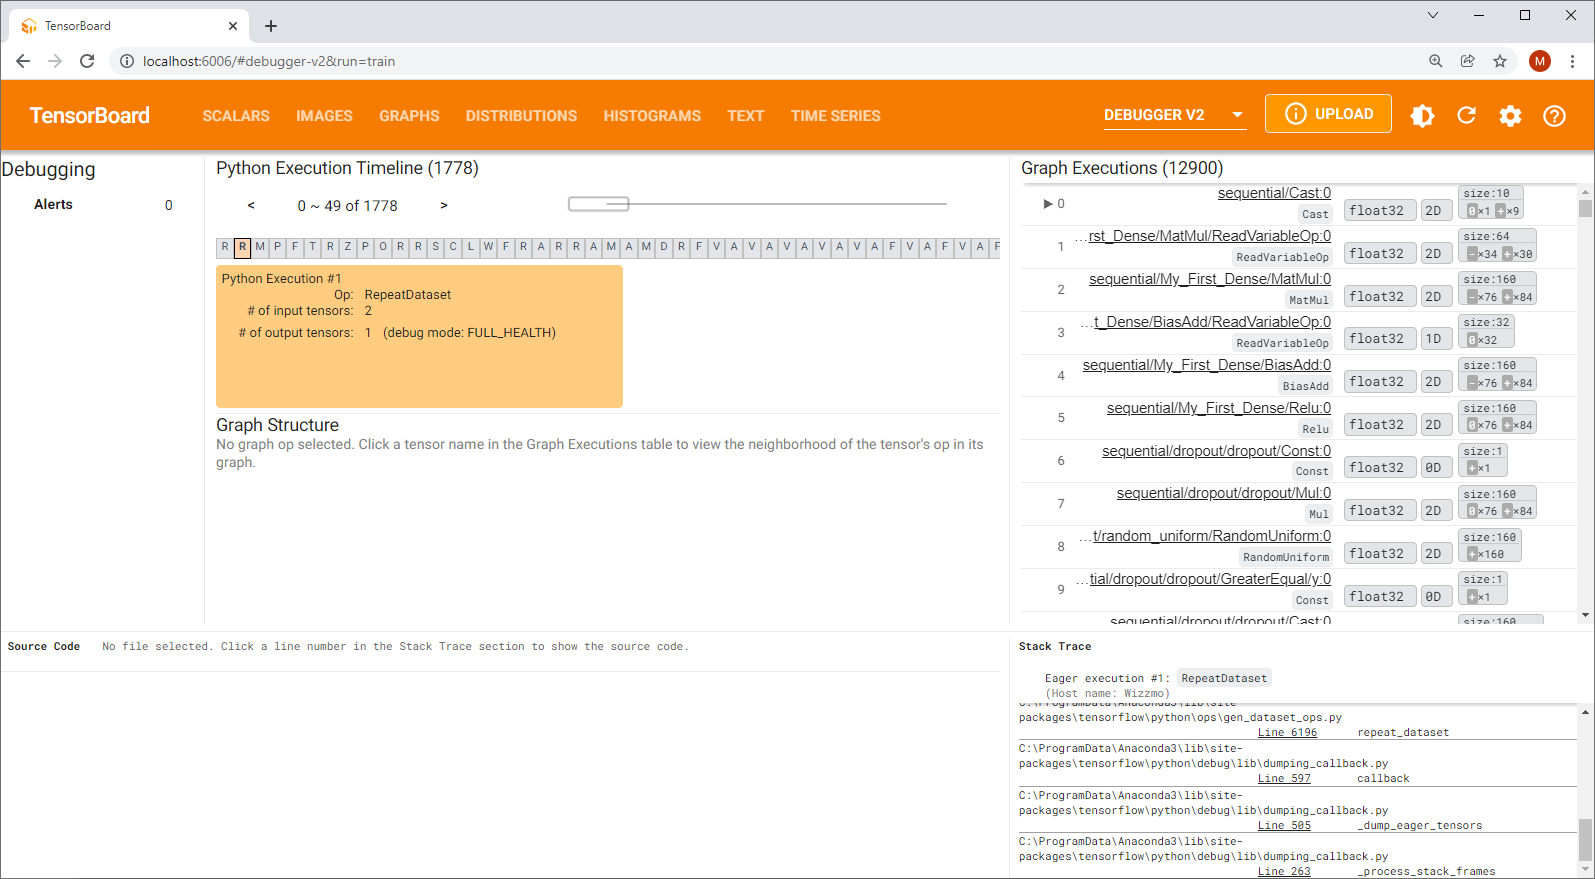
Help I can't see my graph in TensorBoard!
Yes this is the most annoying thing which can happen to you. From my personal experience this problem is not due to the dev but is rather a bug in TensorFlow or better said in the way TensorBoard refreshes its internal data.
Even the timing when you are going to call http://localhost:6006 has its importance!
Solution #1
Here is a possible sequence to solve those problems:
- Press CTRL+C to stop the TensorBoard server
- completely remove/delete the content of your log-directory (./logs_output)
- Launch your code that contains your model and your keras.callbacks.TensorBoard
- Start tensorboard again
Here are other some tricks I'm using:
- Sometimes deleting the cache of your browser helps
- Try to completeley delete the log-directory and change the name of the output
- Not sure the update worked? Try to change the name of your layers within your model
- Check if you have started TensorBoard with the correct logdir parameter that points to the correct log directory
Solution #2
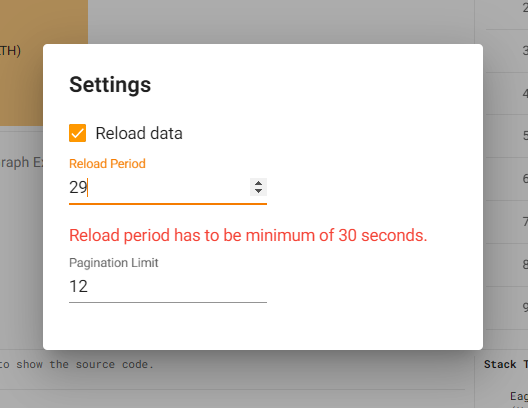
- In TensorBoard the "Reload data period" has to be minimum of 30 seconds: perhaps you are trying to reload the page to quickly!
- Have you checked the "Tag and Run" combobox on the left side of tensorboard ? It's sometimes confusing that's why don't forget to select "Keras" and then you will see the conceptual graph that corresponds to the model you've created.
Do you need personalized help and support for starting your next project with TensorFlow? Then don't hesitate to contact me! I'm offering exclusive consulting services and webinars around TensorFlow (see Shop section).